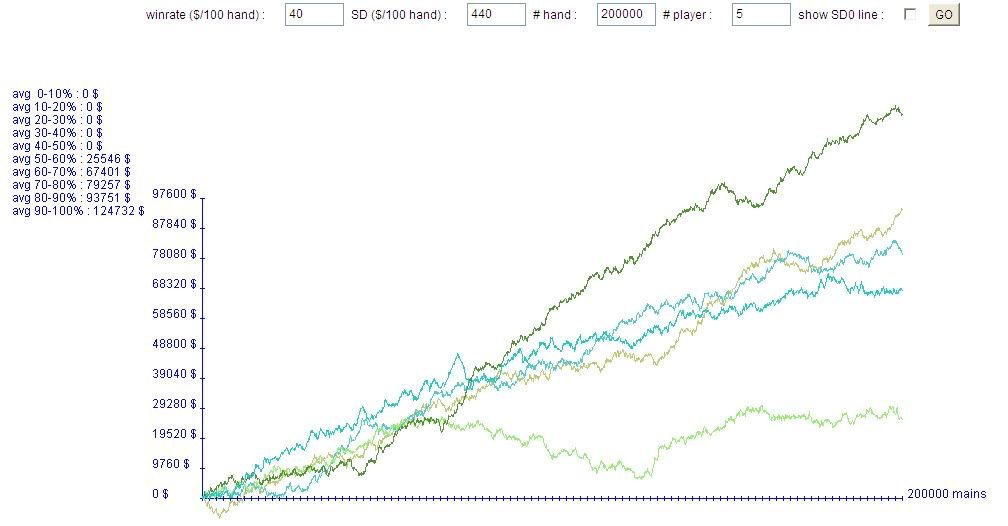
Winrate: 40
SD: 440 (this is an estimate but it's within 10%)
Hands: 200000 (2000*100 and we're trying to simulate 2000 hours)
# of Players: 100
The graph you get is the result of running an experiment where 100 players with the above true win rates and standard deviations play for 2000 hours. The results are pretty mind boggling if you're not ready for it. If you couple in playing multiple stake levels they get even worse; imagine what it could look like if each player took 400 of his hours off this graph and added in 400 hours at double the stakes, in a tougher and more aggressive game, where his win rate went up by only 60-80% (or not at all), but his standard deviation increased by say 125%. That's basically what I did in the second half of 2009, which turned out to be a complete disaster. I think I mentioned on here that at one point I had 200 hour stretch where I won exactly 1 big bet per hour but broke even, due to playing everywhere from a little 6/12 all the way up to 40/80.
I used to run these simulations using a true win rate of $50/hour, and admittedly they look a lot better when you do that. The constant tidal wave of positive expectation keeps the downswings and break even stretches much shorter; you're just absolutely crushing the game. But as you reduce that number towards the "accepted" maximum win rate, you start getting a lot of the artifacts you see here, with guys winning less than $20,000 for an entire year, or being under water for 1500 hours. Enjoy the toy.


5 comments:
Here's some food for thought: should more than 50% of the random walks end up >= $80,000?
I'll bite. Why is the answer not no? It seems pretty intuitive that if you dropped the win rate to zero that exactly 50% (in the long run) should end up in the black. Expected value changes are always constant shifts on graphs so to me it seems like exactly 50% of the walks should top $80K.
Variance is a wonky mofo - drives a fella crazy
In other news, if you take out the $$ equivalent of mental anguish due to an inconsistent income, that hypothetical 80k net should come down quite a bit...
I mean, for me, 60k guaranteed is worth more than "a high probability of ~$80k"... Additionally, the idea of passive income + vacation & health benefits etc go out the window as a pro player...
For it to be worth it to me, I'd have to make enough money to be able to comfortably retire in 3-5 years...as we all know that's never happening.
Jesse: sorry for the delay. Yes, of course you're right. I'm just not seeing that jive with results on your graphs so perhaps the graphs are a little screwy?
Btw, generally speaking the sum of n samples from a N(mu, sigma^2) distribution is itself normal: N(n * mu, n^2 * sigma^2).
Post a Comment